Resources / References / 03
Fervo Energy: Big Tech’s Clean Energy Bet Is Unraveling
E² review · 2026-10-06
Evidence audit
Regulatory balances and catalogue counts reproduced · commercial models unvalidated
The report documents material operating and delivery risks. Its calculations support several narrow findings. They do not establish deliberate concealment, seismic damage or inevitable commercial failure.
Findings
- Project Red water balance
- 192.87 million gallons of cumulative net imbalance. June 2026: 34.68%; July: 22.68%. C17 · C18
- Temperature interval
- 344°F to 332°F across six calendar months annualizes to 24°F/year. Its long-term interpretation remains open. C10
Runnable audit · Frozen inputs · Results · Plot source · Source record
Temperature
Source mapping
Nevada’s workbook identifies injection permit 1505, API 27-013-90146, and production permit 1506, API 27-013-90147. It reproduces the report’s 90°F changes in March 2024 and June 2026. These are plant-operator submissions hosted by a regulator. The report’s page-19 caption calls permit 1506 “34A-22”; the inventory identifies 34A as injection permit 1505. Permit/API mapping is more reliable than the inconsistent names. C04 · C08
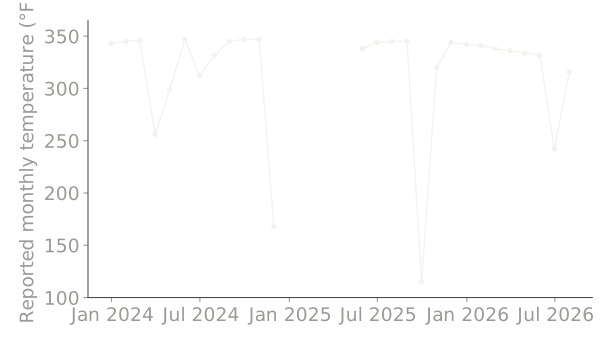
The 2024 paper plots a steadier operating series. A monthly average can differ from a selected flowing-temperature series because of startup, shutdown, measurement location or weighting. Neither side supplies the full bridge here. The difference warrants disclosure; it does not establish falsification or intent. C05
Decline and calibration
LaTeX source
d = \frac{344-332}{6}\times12 = 24\;{}^\circ\mathrm{F}/\mathrm{year}Linear regression across the seven November–May entries gives 24.43°F/year. This is a description of one interval, with no inference of independent monthly errors. June falls to 242°F; July rebounds to 316°F. The cause and the appropriate operating-state exclusions remain unresolved. A forecast must specify those exclusions before looking at the outcomes. C10
The 16× comparison to 1.5°F/year reproduces arithmetically. An economic threshold needs resource temperature, power conversion, flow, useful life and costs. Fervo’s 2026 model describes a tighter, shorter pilot designed to reveal decline sooner. Its fit to observed data is not evidence of prospective prediction without a frozen earlier model and held-out period. C11 · C12
Water
Monthly balance
LaTeX source
L = \frac{I-P}{I}\times100\%,\quad I=\text{injected volume},\ P=\text{produced volume}March’s monthly injection increases 33.42%. The workbook’s reported daily injection increases 29.11%. A monthly-volume comparison must not silently become a flow-rate comparison. February’s reporting date is February 28 in a leap year; the raw daily and monthly fields are retained. The matched imbalance rises from 21.17% to 56.86%. C06 · C07
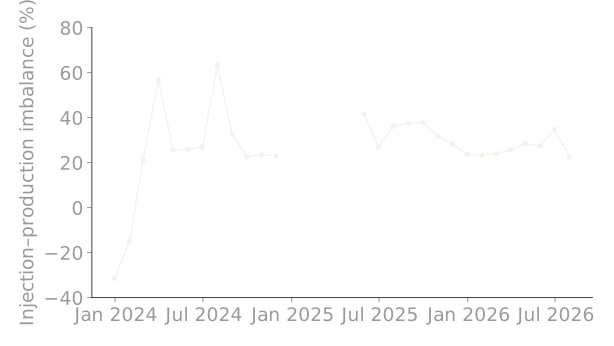
The signed cumulative imbalance is 192,872,191 gallons. Positive deficits alone total 206,737,068; ignoring negative months changes the question. June’s 34.68% is below September 2025’s 37.82%, so the “ten-month high” does not reproduce. July recovers to 22.68%. C17 · C18 · C20
Monthly source entries and calculations
| Month | Temperature °F | Injected gal | Produced gal | Imbalance % |
|---|---|---|---|---|
| 2023-12 | 343 | 28,932,480 | 38,031,329 | -31.45 |
| 2024-01 | 345 | 32,137,920 | 36,903,948 | -14.83 |
| 2024-02 | 346 | 31,972,320 | 25,204,320 | 21.17 |
| 2024-03 | 256 | 42,656,079 | 18,401,760 | 56.86 |
| 2024-04 | 299 | 26,645,760 | 19,833,120 | 25.57 |
| 2024-05 | 347 | 32,840,640 | 24,345,290 | 25.87 |
| 2024-06 | 312 | 28,964,160 | 21,179,520 | 26.88 |
| 2024-07 | 332 | 2,968 | 1,093 | 63.17 |
| 2024-08 | 345 | 32,879,520 | 22,186,684 | 32.52 |
| 2024-09 | 347 | 30,179,520 | 23,355,360 | 22.61 |
| 2024-10 | 347 | 32,091,840 | 24,544,800 | 23.52 |
| 2024-11 | 168 | 1,365,984 | 1,054,080 | 22.83 |
| 2024-12 | No production | 0 | 0 | N/A |
| 2025-01 | No production | 0 | 0 | N/A |
| 2025-02 | No production | 0 | 0 | N/A |
| 2025-03 | No production | 0 | 0 | N/A |
| 2025-04 | No production | 0 | 0 | N/A |
| 2025-05 | 338 | 12,809,616 | 7,488,000 | 41.54 |
| 2025-06 | 344 | 28,103,040 | 20,550,240 | 26.88 |
| 2025-07 | 345 | 30,516,480 | 19,478,880 | 36.17 |
| 2025-08 | 345 | 31,610,880 | 19,765,440 | 37.47 |
| 2025-09 | 115 | 10,296,960 | 6,402,240 | 37.82 |
| 2025-10 | 320 | 30,162,240 | 20,609,280 | 31.67 |
| 2025-11 | 344 | 33,965,088 | 24,353,280 | 28.30 |
| 2025-12 | 342 | 33,536,160 | 25,597,440 | 23.67 |
| 2026-01 | 341 | 33,472,800 | 25,685,280 | 23.27 |
| 2026-02 | 338 | 31,577,760 | 24,045,120 | 23.85 |
| 2026-03 | 336 | 34,715,520 | 25,796,160 | 25.69 |
| 2026-04 | 334 | 34,863,840 | 24,972,480 | 28.37 |
| 2026-05 | 332 | 36,658,080 | 26,677,440 | 27.23 |
| 2026-06 | 242 | 27,931,680 | 18,244,800 | 34.68 |
| 2026-07 | 316 | 29,502,720 | 22,812,480 | 22.68 |
Retention and water rights
Fervo acknowledges approximately 70% pilot recapture. ResFrac’s multi-well model explains how outer producers and pumping could reduce imbalance; it supplies a testable mechanism. It has not validated Cape Station’s claimed commercial recovery here. “Not yet demonstrated” and “cannot work” require different evidence. C15 · C16 · C19 · C21
Water injected into rock but not immediately recovered may be stored, migrate elsewhere or interact with surrounding fluids. Its eventual location and timing require a hydrogeologic balance. Legal non-consumptive use additionally depends on the approved water-right conditions. General Utah policy does not authenticate the specific grant. The report’s application links were inaccessible, so its exact conditions remain unverified. C24 · C25
Power and capacity
| Comparison | Result | Meaning |
|---|---|---|
| 2.1 MW gross / 3 MW gross | 70.00% | Comparable power units; not calendar capacity factor |
| 1.4 MW net / 3 MW gross | 46.67% | Gross/net mismatch |
| 36 kg/s / 80 kg/s modeled | 45.00% | Reported average against target |
| 2.1 MW gross / 5.1 MW modeled | 41.18% | Average against modeled target |
The 2023 paper’s 5.1 MW estimate assumes 35% thermal recovery, 15% conversion efficiency and ten years of useful life. The later 2.1 MW gross average is 41.18% of that modeled value. A capacity factor requires calendar energy divided by comparable nameplate capacity and calendar hours. The pilot’s average, selected on-production period and different gross/net figures cannot substitute for that calculation. C09 · C13 · C14
The 2024 Frisco paper estimates electric output from thermal flow and anticipated plant performance; it publishes initial power data from a thirty-day test. This is not thirty days of measured net generation. Meanwhile, Fervo’s October 1 announcement reports 33 MW net and September 30 commercial operation. That is a company attribution, with no sustained metered series authenticated here. Date the report’s “zero megawatts” interview before treating it as current evidence. C22 · C23 · C46
Costs and contracts
Lazard’s 2026 analysis identifies $107/MWh as an illustrative new-geothermal point using $7,000/kW installed capex and $160/kW-year fixed O&M. Matching two inputs does not produce Fervo’s project-specific cost. The source also supplies a tax-credit sensitivity. Financing, conversion, capacity factor, price escalation and credit monetization require a common cash-flow model. Levelized total cost is different from marginal operating cost. The $99 price remains an analyst attribution. C26
The long-term $3,000/kW target requires a 57.14% reduction from $7,000/kW. The Phase II $5,500/kW target requires 21.43%. These are conditional targets. Conference estimates, actual installed cost and changed designs need a bridge before an upward estimate proves a worsening learning curve. A change in chart presentation does not settle concealment. Anonymous completion costs remain unverified. C27 · C28 · C29 · C30
| Quantity | Reproduced result |
|---|---|
| $700/MW-day × 115 MW × 7 days | $563,500 |
| 872,140 MWh / (115 MW × 8,760 h) | 86.57% |
| 80% × 872,140 MWh | 697,712 MWh |
| That threshold / nominal annual energy | 69.26% |
The screenshot’s arithmetic checks out. The full contract link returned 403. Actual default requires the executed measurement period, excused-energy provisions, deadlines and cure rights. The report’s footnote acknowledges excused product and a two-year period. Its prospectus supports material cancellation risk, not an already-triggered default. C31 · C32 · C33 · C34
Transmission
The prospectus discloses 290 MW of rights, enough for original SCE/CPA commitments but insufficient for the expanded 384 MW. It explicitly warns of additional-capacity risk. Fervo’s August update confirms a Utah delivery point retiring in 2027. Its CAISO comment conditions a pre-2032 pathway on timely new planning. These substantiate delivery risk. Rights held, usable delivery capacity, plant completion and amended customer dates still need separate schedules. C35 · C36 · C37
Seismicity
Catalogue comparisons
| Selection | Count |
|---|---|
| Company: 2 ≤ magnitude < 3, through April 2026 | 58 |
| USGS linked window: August 25–September 25 | 39 |
| USGS prose window: August 26–September 25 | 37 |
| Company: November 2025–April 2026 | 36 |
| Company: March–April, inclusive 2 boundary | 30 |
| Company: March–April, strictly above 2 | 29 |
The company series reproduces 58 yellow events and the published six-month count of 36. Exactly one April event has magnitude 2.00. Excluding it gives 29 March–April events but 57 total. This boundary must be consistent. The June 29 blog predates the interview described as July; “weeks after” needs correction or an archived disclosure history. C38 · C39 · C40
The report’s linked USGS search begins August 25, one day before its prose window. Those two additional events explain 39 versus 37. The linked window contains 38 events below magnitude 3 and 1 above it, so “39 yellow” also needs qualification. A regional box is not a list of events proven to be caused by Fervo. Network sensitivity, magnitude methods, observation windows and injection exposure differ between catalogues. Comparing their raw counts does not calibrate a future earthquake probability. C41
Attribution and damage
USGS event uu80156586 records ML 3.13, 2026-09-12T22:52:29.720Z, and depth 3.65 km. It supports the reported nearby event. A traffic-light threshold supports a conditional pause requirement, not proof of an actual shutdown. No shutdown or casing-failure log was obtained. C42 · C43 · C44
Higher activity is a legitimate monitoring concern. Frequency, magnitude, ground motion, fault interaction and casing damage are separate variables. Matching failure times and locations to events, and testing pressure, construction and corrosion alternatives, is necessary before attributing damage. The company’s low reported surface ground motion does not independently rule out subsurface casing damage.
Revision tests
- Reconcile daily and monthly temperatures, meter locations, operating-state filters, zero-volume periods and the anomalous July 2024 volumes.
- Freeze reservoir forecasts before new outcomes. Compare matched net generation, temperatures, flow, pressure and water balance on held-out operating intervals.
- Publish full Cape test records, failure/repair logs and dated seismic response records. Keep source identities authenticated without exposing private witnesses.
- Release approved water-right conditions and the field-scale recovery model. Define timescales and failure thresholds for the pressurization and recharge hypotheses.
- Reconcile all-in installed costs, tax credits, PPA terms, liquidity and delivery pathways. Test lower output, higher water use, delay and replacement-transmission cases.
- Set an explicit horizon and observable commercial-failure criteria. Record what would weaken the report’s thesis as well as what would strengthen it.
The present evidence substantiates operational imbalances and transmission exposure. Commercial longevity, profitability, intentional concealment and claimed seismic damage remain unresolved. C45